Leveraging Microsoft Azure for Successful Stock Option Trades - Part 2
Reshape trading insights and successfully predict stock option trades with Azure Machine Learning. Part 2 in this blog post series outlines the process.
Welcome to Part 2 of our exploration into how Microsoft Azure is transforming stock option trading. In our previous post, Part 1, we delved into the business problem and the solution for collecting data on a list of stock symbols. Part 2 now takes a deeper dive into the utilization of the collected data in conjunction with Azure Automated ML.
If you haven't had the chance to read Part 1, I recommend doing so to get the full context. You can find it right here.
Introduction:
In the initial segment of this blog post (Part 1), I outlined the process I employed to gather data for potential options spread trades. This method allowed me to efficiently retrieve quotes and evaluate prospective option spread trades for an extensive list of stock symbols. By implementing this approach, I swiftly compiled data for more than 200 tickers and seamlessly integrated it into Power BI. Within Power BI, I employed filters to identify trades with a potential return exceeding 25%. This involved a simple adjustment of the filter criteria within the Power BI report.
While the outcomes were quite powerful, I recognized the opportunity for further refinement.
That's when I opted to enhance the existing dataset by incorporating supplementary features, thereby laying the groundwork for the integration of Azure Automated ML.
Enhancing Data Insights with Azure Automated ML:
Building on the foundation we laid in Part 1, let's now focus on refining our data analysis. To start off, let me reiterate that creating our stock symbol list involved selecting the top 200 high-performing stocks from a reliable financial source. This list came from a reputable financial publication with each company meeting very specific criteria. I took this approach because these companies tend to act more stable since they have good technical characteristic such as Earnings Per Share (EPS), Return on Equity (ROE), Quarter over quarter & year over year earnings growth etc. Additionally, these stocks are typically in an uptrend and are supported by institutions and mutual funds. Because of this, these stocks often obey commonly followed technical indicators such as Keltner Channels, Moving Averages (EMA or SMA) and RSI indicators.
To illustrate, let's look at Apple's chart displaying the mentioned technical indicators. The chart highlights Apple's consistent uptrend over a period of 8+ weeks, with price fluctuations oscillating between the middle Keltner line and the 21-day Exponential Moving Average (EMA). This visualization highlights the possibility that if a call spread could be bought at a strike price below the 21-day EMA at the correct time, then it would have a higher chance of success.
With the dataset prepared, the next step was to integrate Azure Automated ML to gain valuable insights.
System Implementation:
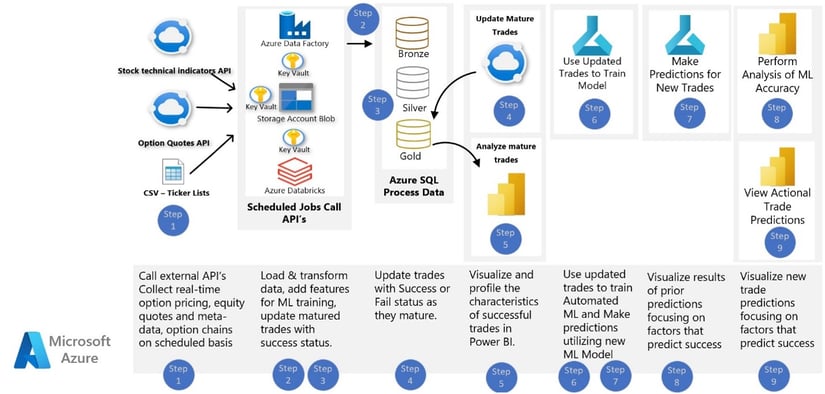
The following image represents the full process after the integration of Azure Automated ML. The intricacies of the data collection process are explored in more detail in Part 1 of this series. For now, let's zero in on the Machine Learning aspect.
Steps 6, 7, 8 and 9 were added to the diagram below. In order to present the complete process however the other steps along with their descriptions were left in place. This will help to provide context in the event you have not read Part 1 of this post.
Solution Components:
Azure Data Factory (ADF) – A data integration service used to copy data and orchestrate activities via pipelines
Azure Data Lake Storage (ADLS2) – An Azure storage account providing blob, file share, and table storage.
Azure SQL Database – A relational database-as-a-service (DBaaS) hosted in Azure.
Power BI – A unified, scalable platform for self-service and enterprise business intelligence (BI).
Data Flow Description:
Pipelines were built within Azure Data Factory (ADF) for the purpose of orchestrating the movement of data from external sources through processing steps within Azure.
The following is an outline of those steps with numbering that corresponds to the diagram above:
Step 1:Data Retrieval: External APIs are tapped into using a combination of ADF and Databricks. When authorization tokens are involved, Azure Key Vault is utilized for secure storage. This approach bolsters security by shielding sensitive information from direct exposure in the code.
Step 2: Data Storage: The data collected is transferred in its raw form to an Azure SQL database in its raw form.
Step 3:Data Processing: Once the data is landed in Azure SQL the data is processed using a multi-step medallion architecture. As data moves through the processing layers data is transformed and calculations are performed. These calculations help to determine if a given options chain contains any actionable trades.
Step 4:Automation: On option expiration days, an automated process is triggered to fetch closing quotes for the underlying stock/equity. These closing prices are then used to update the status of option spreads expiring on that day, categorizing them as 'Success' or 'Fail.' These updated trades are referred to as 'mature' trades
Step 5:Power BI Integration: Data can now be refreshed in Power BI in order to analyze the characteristics of successful trades. Data is provided through an SQL view within the Azure SQL database. Some additional data manipulation is done within the Power BI data model in order to provide better analysis.
Step 6:Model Training: Once an ample number of trades have been amassed and matured, the next step involves training the model. According to Microsoft, "Automated machine learning is the process of automating the time-consuming, iterative tasks of machine learning model development. It allows data scientists, analysts, and developers to build ML models with high scale, efficiency, and productivity all while sustaining model quality." During the training process, Azure Machine Learning runs multiple pipelines in parallel, testing various algorithms and parameters. Each iteration yields a model with a training score. The better the score for the desired metric, the more favorably the model is considered to 'fit' the data. The process concludes when it meets the defined exit criteria.
In taking this approach we rely on the brains at Microsoft to determine the best approach for the ML Model. This process predicts the likely outcome of each trade (success or fail) along with a confidence score for the prediction.
Step 7:Predictions: Armed with a trained model, we proceed to make predictions. To manage costs effectively, I manually feed test data into the model, foregoing deployment to a web service. This allows me to run a dataset through the process and receive output in a .csv format. Subsequently, the CSV file is imported back into the SQL database for thorough analysis.
Step 8:Validation and Analysis: As the trades predicted in Step 7 reach maturity, their actual outcomes are updated in SQL Server. These outcomes are then compared to the predictions made in Step 7. The results are visualized in Power BI, offering valuable real-time feedback and enhancing confidence in the predictive outcomes.
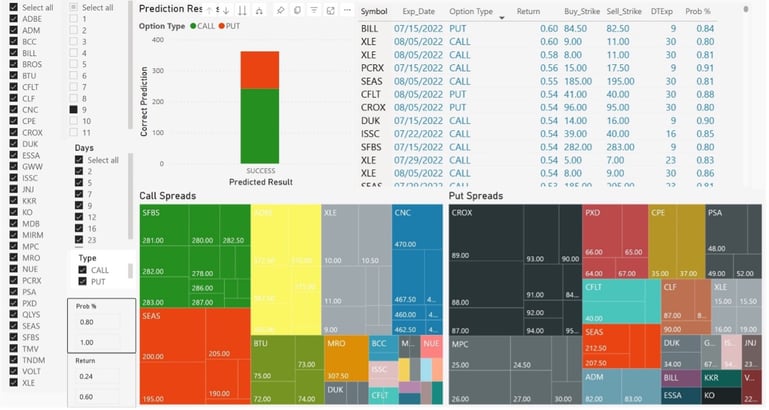
Step 9:Final Insights: Here's where all the hard work pays off. Power BI equips me to swiftly assess newly collected trade scenarios. I can filter trades based on specific criteria while simultaneously reviewing the predictive model's projections. For instance, the report might showcase trades with a predicted probability score ranging from 80% to 100%, and an expected return between 24% and 60%. The report also factors in the days remaining until trade maturity. If I want to drill down on a particular stock I can do so in the Tree Map visualization.
Conclusion:
The Microsoft Azure environment has all the tools needed to create end to end solutions for a variety of applications. In the case of this project, I was able to perform each of the tasks within multiple integrated environments. The overall process allows me to identify actionable trades across a long list of stocks much more efficiently. Instead of manually running quotes for 200 stocks, this process does the heavy lifting, optimizing efficiency. Additionally, the insights derived from Microsoft's Automated ML provide meaningful guidance, instilling a higher level of confidence in the likelihood of trade success.
Tools Utilized:
Azure Data Factory (ADF), Azure SQL Database, Databricks, Azure Storage Account, Azure Key Vault, Azure Automated ML, and Power BI.
Languages Utilized:
T-SQL, Python, PySpark, DAX
As we navigate the Azure landscape, endless opportunities emerge, promising to reshape the landscape of trading insights.
Note:
The above notes are as of the original date of this post (Augugust 6, 2023). The functionality will continue to evolve as the products mature.
The above solution was designed and implemented by Eric Pietroski. Please direct all questions to Eric.Pietroski@eastern-analytics.us
Technical Lead / Architect - 25+ Years of application development, Data Analytics and Transformations, MS Azure, Data Engineering, GitHub Actions, Azure Messaging Services and Azure SQL
Here is a working example of a project where we needed to source data from Google BigQuery and copy it to an Azure SQL Database using Azure Data...
Scott Pietroski
Oct 1, 2020
Get notified on new marketing insights
Be the first to know about new B2B SaaS Marketing insights to build or refine your marketing function with the tools and knowledge of today’s industry.